Aim
To show that Action=-Reaction is always true.
Subjects
1H10 (Action and Reaction)
Diagram
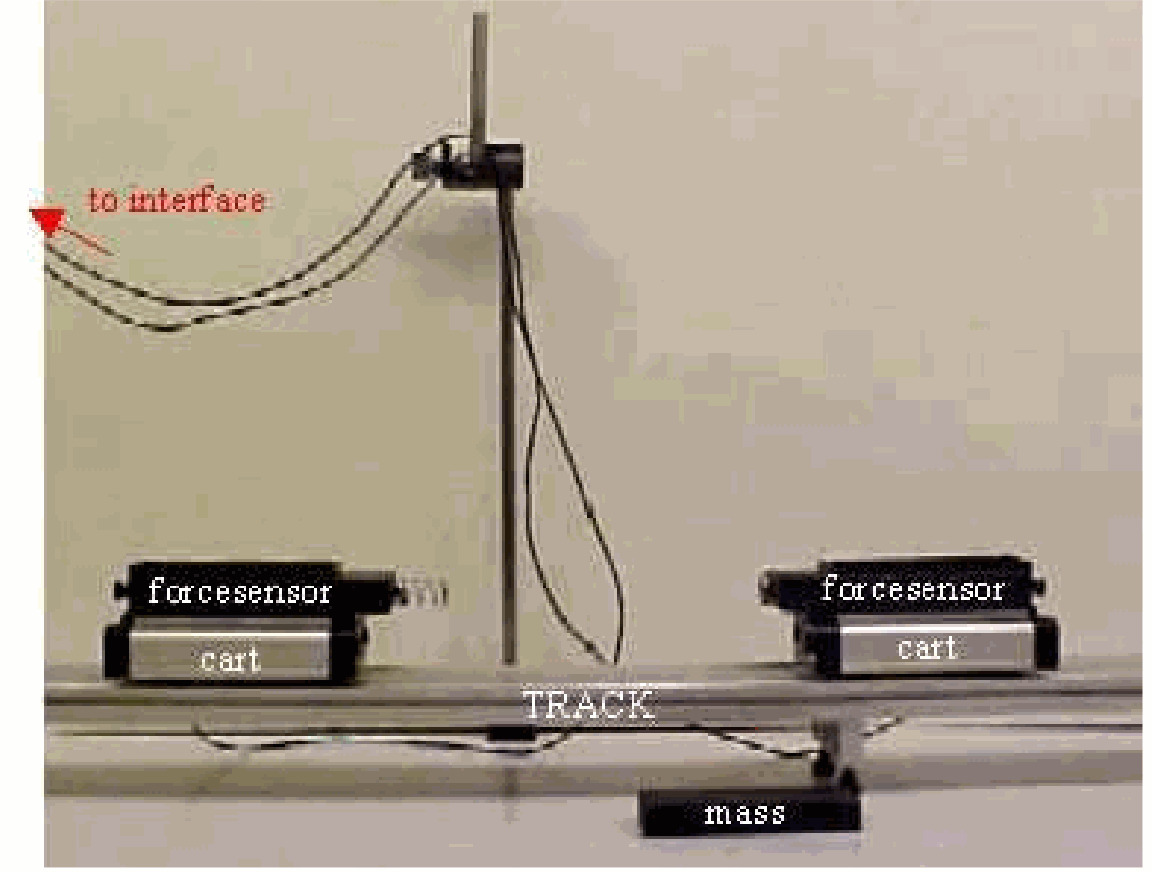
Equipment
Track, .
Two collision carts
Two force sensors, one of them mounted with a spring.
Mass, .
Interface and data-acquisition system (we use PASCO ScienceWorkshop).
Projector to project on the monitor screen.
Presentation
Presentation: The force sensors are attached to each cart and connected to the interface (see Diagram). The software is prepared to read and graphically display both forces to during about . Both carts are positioned on the track at about away from each other. The data recording is started, and both carts are pushed towards each other manually. The recording is stopped after a collision occurs. Students can now observerve the registered force data (see Figure 2 left).
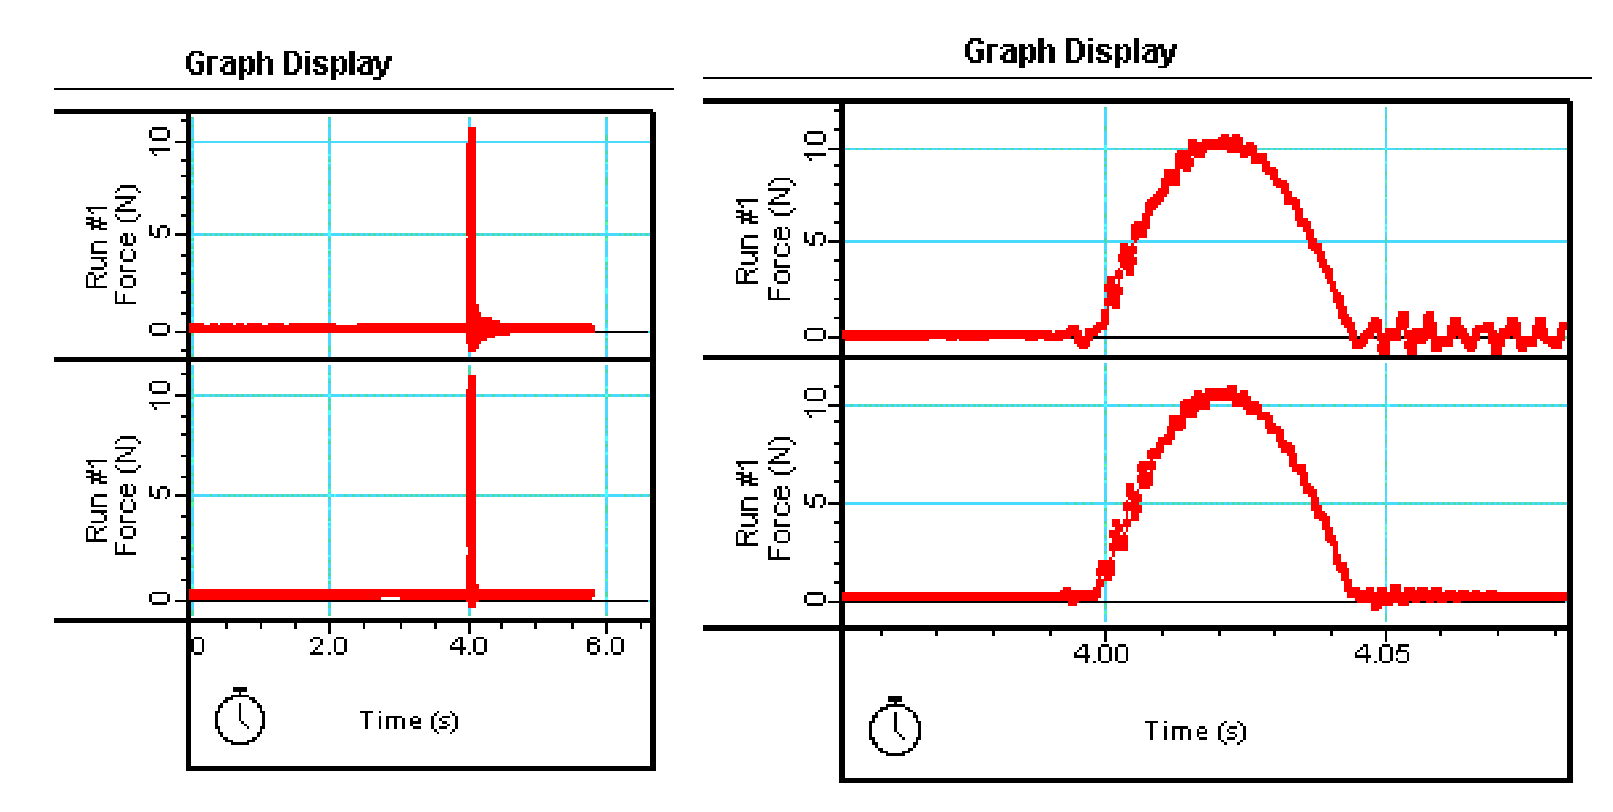
The part of the data that resembles the collision is magnified (see Figure 2 right). It can be seen that at any moment, the force on both carts is the same. is added to one of the carts. The demonstration is repeated, again showing that the forces registered during the collision are the same at all times both carts!
Explanation
Newton’s third law states , which is supported by the results of these demonstrations.
Remarks
The speed you give the carts by hand is, of course, not important. But when students doubt, redo a run with one cart standing still or moving at a different speed in the same direction. The data-registration will always show .
In the right graph of Figure 2 can be seen which cart has the spring mounted to its force sensor: A damped vibration is seen after the collision. The force sensor itself also vibrates after the collision, as shown in the graph of the other force sensor.
Sources
Mansfield, M and O’Sullivan, C., Understanding physics, pag. 119