Aim
To show empirically that Kepler’s third law is true.
Subjects
1L20 (Orbits)
8A10 (Solar System Mechanics)
Diagram
Equipment
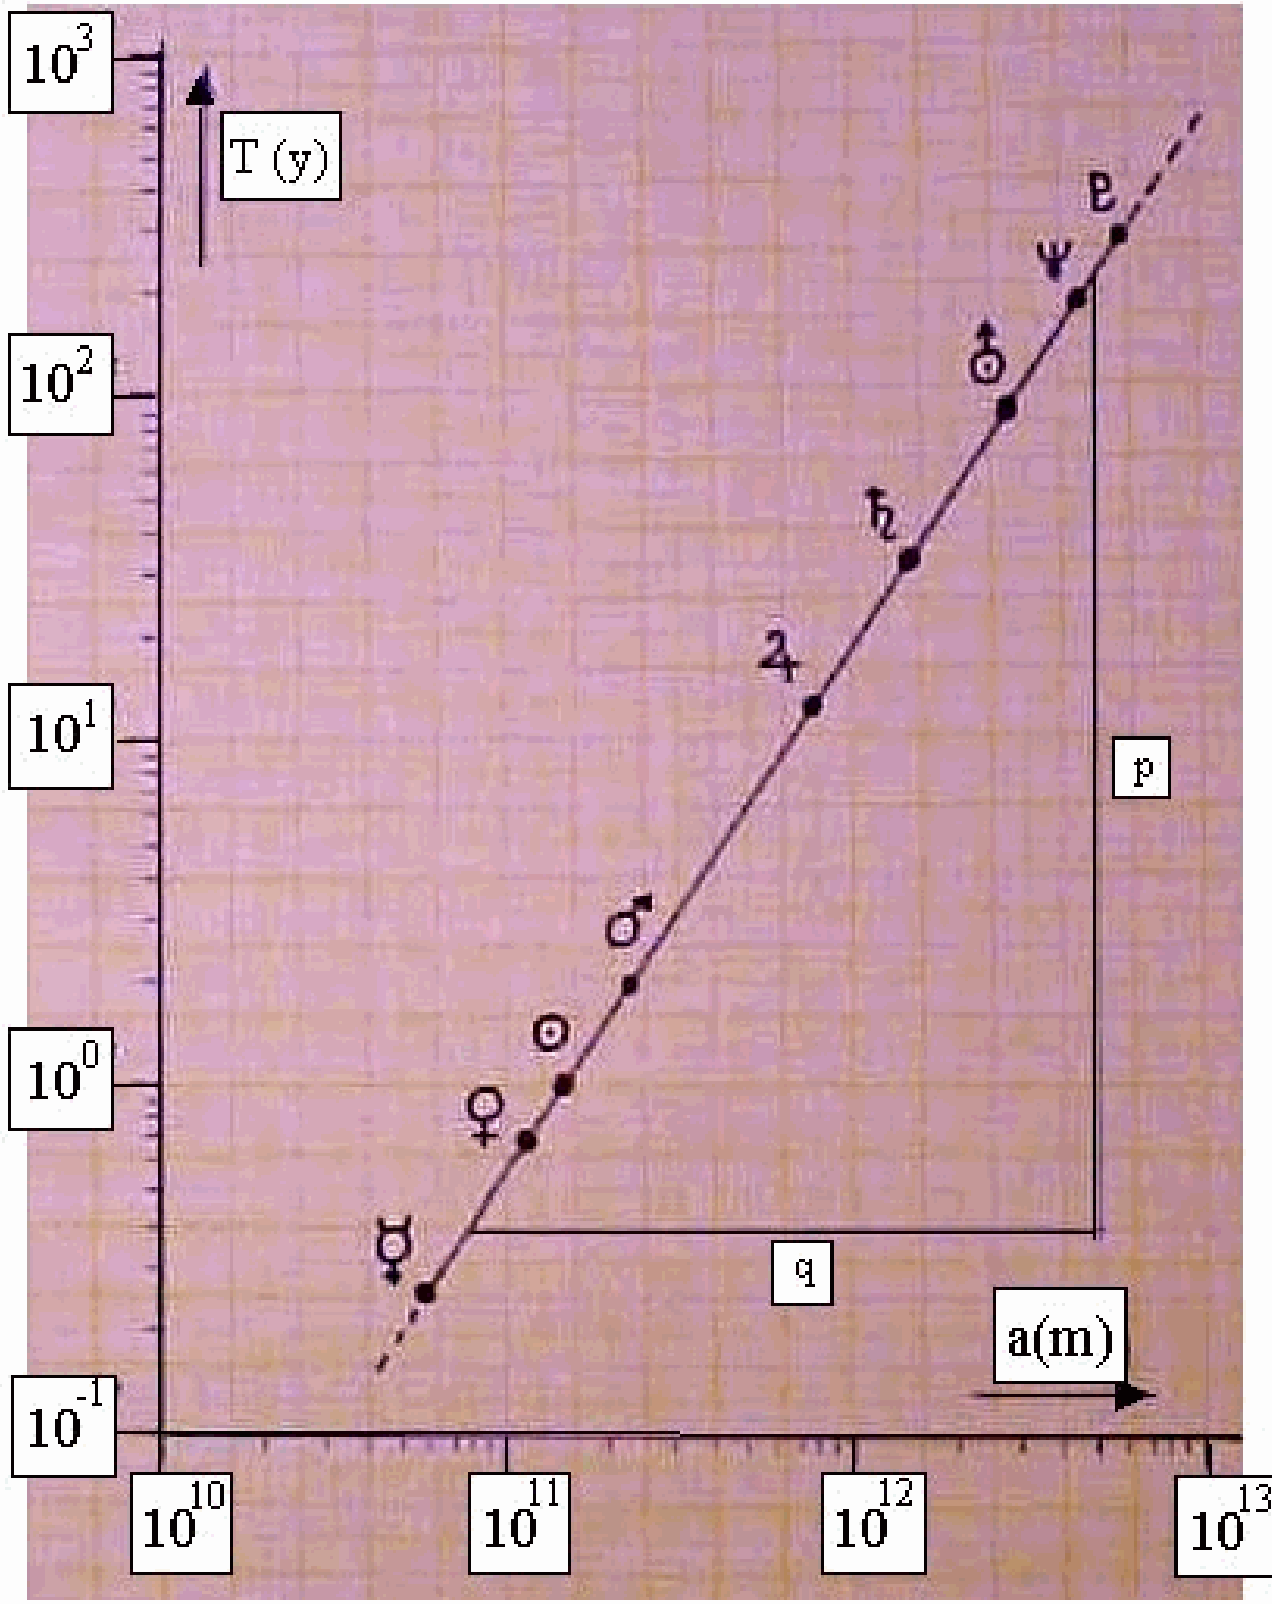
Graph on overhead sheet, , and a both scaled logarithmically.
Table with data of the planetary system (see Sources).
Presentation
The graph is projected by means of an overhead sheet. The relationship with the table of planetary data is elucidated. Clearly can be observed that the data fit on a straight line in such a double logarithmic graph. The slope of this line () equals 1.5. This is the relationship of the powers in Kepler’s third law:
Explanation
Kepler’s third law states with a constant. Taking logarithms on both sides, we can also write:
and:
So when T and a are graphed logarithmically (with – and -decades equally spaced), we see a line whose slope () is the power-relationship in the original function.
Simulations
ISSUE: SIMULATION NEEDED
Sources
Mansfield, M and O’Sullivan, C., Understanding physics, edition 1998, pag. 106-107 and 741 (planetary data).
BINAS tabellenboek, vijfde druk, tabel 31.
McComb, W.D., Dynamics and Relativity, edition 1999, pag. 72-74.
Roest, R., Inleiding Mechanica, vijfde druk, pag. 257-258.
Stewart, J, Calculus, edition 1999, pag. 867.