Bepaling van de geluidsnelheid van lucht#
In dit demo-experiment bepalen we de geluidsnelheid van lucht op basis van metingen aan frequenties van open-gesloten systemen (pvc buizen). Daarbij geldt: \(f=v/\lambda\) met \(\lambda=4L+\Delta L\).
#Import libraries
import numpy as np
import matplotlib.pyplot as plt
from scipy.optimize import curve_fit
from scipy.stats import norm
#Metingen aan de buizen
L = np.array([10.0, 19.5, 24.9, 29.8, 35.5])*1e-2 #input in cm
u_L = np.ones(len(L))*.3e-2 #m
f_0 = np.array([, , , , ]) #Hz
u_f_0 = np.ones(len(f_0))*5 #Hz

lambda_f_0 = 4*L
u_lambda_f_0 = 4*u_L
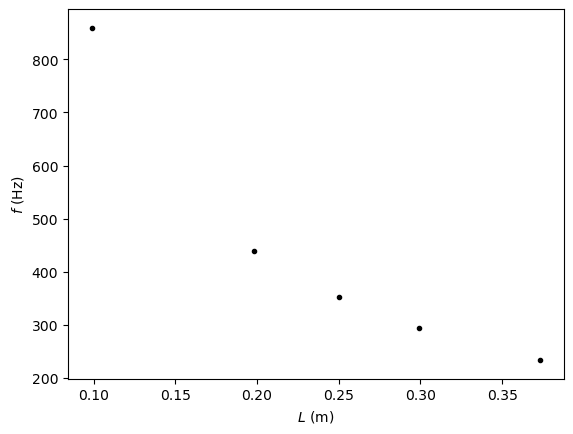
#Plotten van de data
plt.figure()
plt.errorbar(L,f_0,xerr=u_L,yerr=u_f_0,linestyle='none')
plt.plot(L,f_0,'k.')
plt.xlabel('$L$ (m)')
plt.ylabel('$f$ (Hz)')
plt.show()
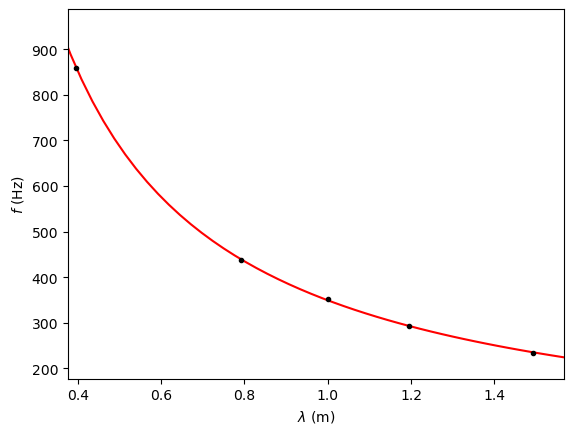
#functionfit
def funcfit(x,v,dL):
    return v/(x+dL)

var, cov = curve_fit(funcfit,lambda_f_0,f_0,p0=[343,2e-2])
print(var)
print()
print('De geluidsnelheid in lucht is:', round(var[0],0),'+/-',round(np.sqrt(cov[0,0]),1),'m/s')
[3.55586519e+02 1.74097002e-02]

De geluidsnelheid in lucht is: 356.0 +/- 2.0 m/s
#plotting the data and the fitfunction
x = np.linspace(0.9*min(lambda_f_0),1.1*max(lambda_f_0))
y = funcfit(x,var[0],var[1])

plt.figure()
plt.plot(x,y,'r-')
plt.plot(lambda_f_0,f_0,'k.')
plt.xlabel('$\lambda$ (m)')
plt.ylabel('$f$ (Hz)')
plt.xlim([0.95*min(lambda_f_0),1.05*max(lambda_f_0)])
plt.show()
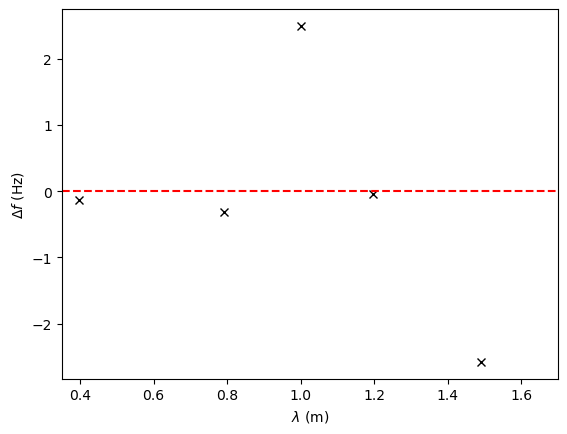
#plotting the residuals
plt.figure()
plt.plot(lambda_f_0,f_0-funcfit(lambda_f_0,*var),'kx')
plt.xlabel('$\lambda$ (m)')
plt.ylabel('$\Delta f$ (Hz)')
plt.hlines(0,0.35,1.7,colors='r', linestyles='dashed')
plt.xlim([.35,1.7])
plt.show()
#solutions
L = np.array([9.9, 19.8, 25.1, 29.9, 37.3])*1e-2 #input in cm -> m
u_L = np.ones(len(L))*0.2*1e-2 #m
f_0 = np.array([804,421,334,281,227]) #Hz
u_f_0 = np.ones(len(f_0))*2 #Hz

lambda_f_0 = 4*L
u_lambda_f_0 = 4*u_L
plt.figure()
plt.errorbar(L,f_0,xerr=u_L,yerr=u_f_0,linestyle='none')
plt.xlabel('$L$ (m)')
plt.ylabel('$f$ (Hz)')
plt.show()
def funcfit(x,a,b):
    return a/(x+b)

var, cov = curve_fit(funcfit,lambda_f_0,f_0,p0=[343,2e-2])
print(var)
print()
print('De geluidsnelheid in lucht is:', round(var[0],0),'+/-',round(np.sqrt(cov[0,0]),1),'m/s')
x = np.linspace(0.9*min(lambda_f_0),1.1*max(lambda_f_0))
y = funcfit(x,var[0],var[1])

plt.figure()
plt.plot(x,y,'r-')
plt.plot(lambda_f_0,f_0,'k.')
plt.xlabel('$\lambda$ (m)')
plt.ylabel('$f$ (Hz)')
plt.xlim([0.95*min(lambda_f_0),1.05*max(lambda_f_0)])
plt.show()
plt.figure()
plt.plot(lambda_f_0,f_0-funcfit(lambda_f_0,*var),'kx')
plt.xlabel('$\lambda$ (m)')
plt.ylabel('$\Delta f$ (Hz)')
plt.hlines(0,0.35,1.7,colors='r', linestyles='dashed')
plt.xlim([.35,1.7])
plt.show()