02 Stefan-Boltzmann Law for Radiation#
Aim#
To show that the power radiated by an area is proportional to T4.
Subjects#
4B40 (Radiation)
Diagram#
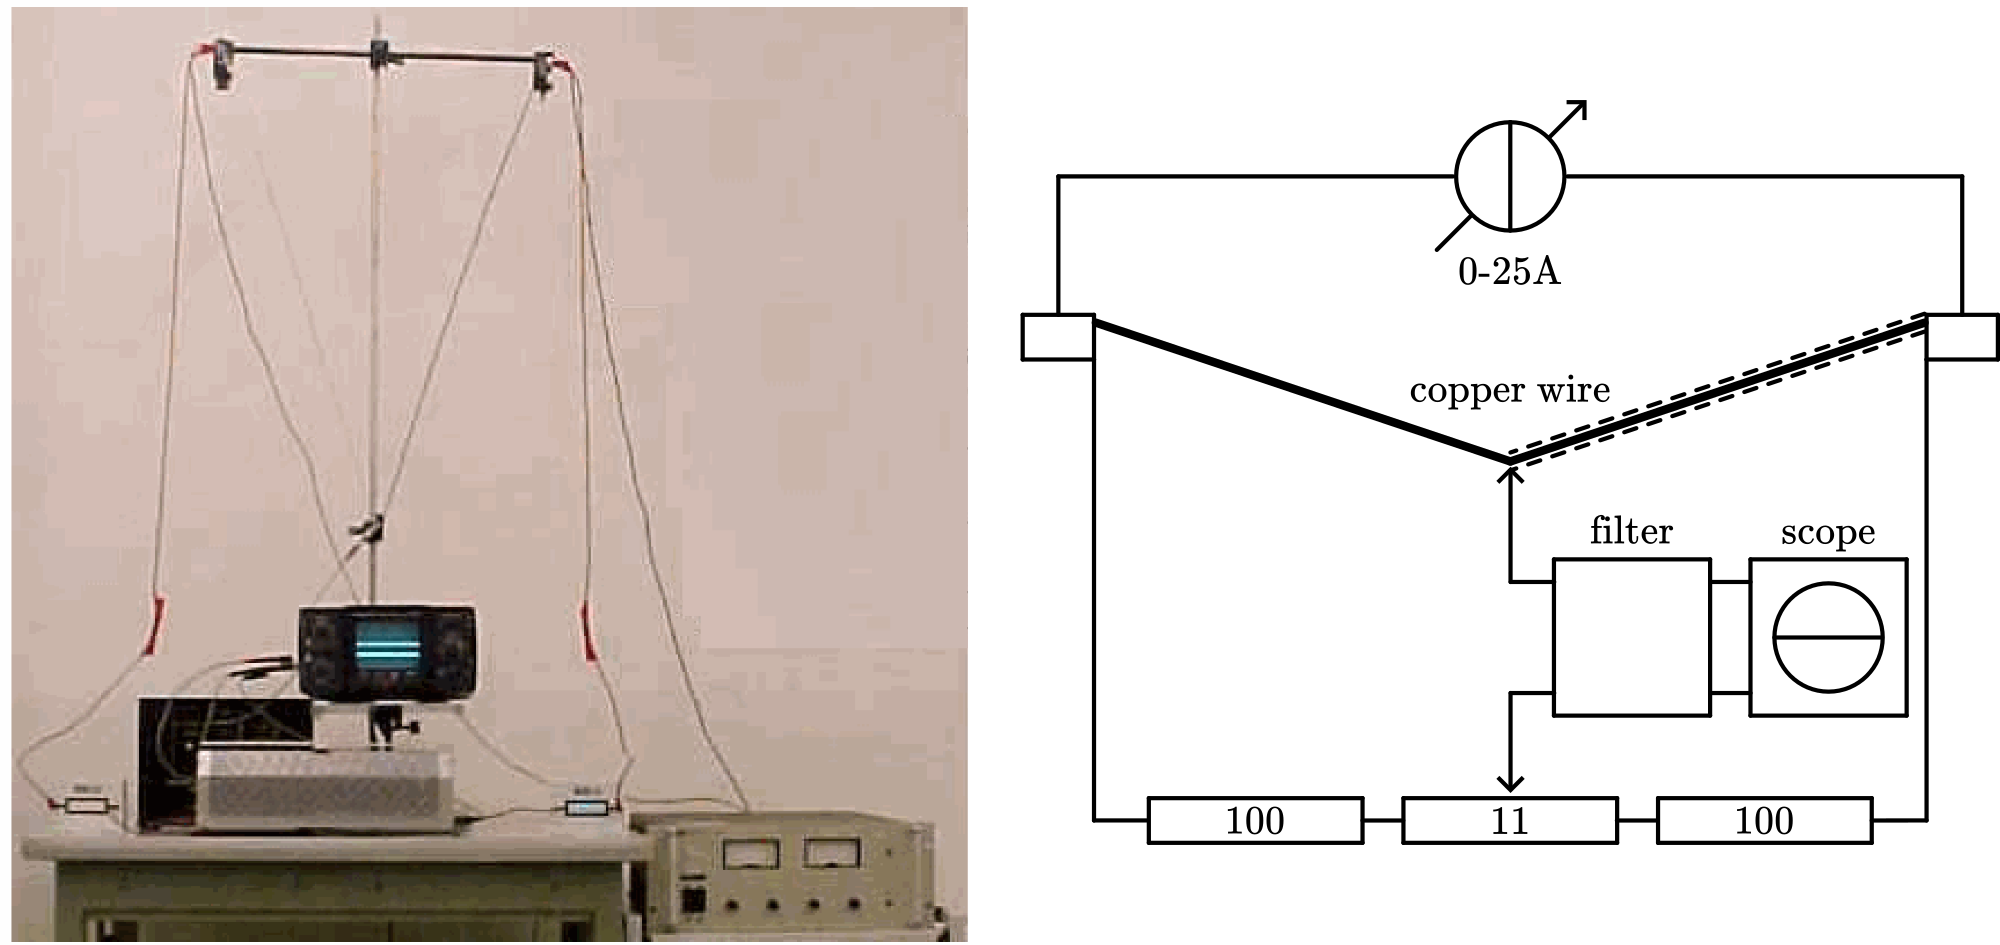
Fig. 384 .#
Equipment#
Electric hot plate.
Radiation sensor (thermopile).
Measuring amplifier.
Temperature sensor.
Heat-conducting compound.
Interface and data-acquisition system (we use PASCO ScienceWorkshop).
Projector to project monitor screen.
Presentation#
Preparation.#
The temperature sensor is pressed to the hot plate using the spring/clamp mechanism (see Diagram). There is heat-conducting compound between the temperature sensor and plate. The radiation sensor “looks” at an area close to the temperature ensor. The software of the data-acquisition system is prepared to measure, every second: radiation \((P)\), as a voltage and temperature. Four graphs are displayed simultaneously on the monitorscreen: Radiation as a function of \(T(K), T^{3}\left(\mathrm{~K}^{3}\right), T^{4}\left(\mathrm{~K}^{4}\right)\) and \(T^{5}\left(\mathrm{~K}^{5}\right)\) respectively. Also a digital display reading temperature in \({ }^{\circ} \mathrm{C}\) is added to the screen.
Presentation#
The electric hot plate is switched on, on its lowest setting. The digital temperature meter shows the rising temperature of the plate.
Fig. 385 .#
As soon as the temperature of the plate reads about \(30^{\circ} \mathrm{C}\), the data-acquisition system is started to record temperature- and radiation measurements. Slowly temperature rises and the teacher can go on with his lecture. It takes about 30 minutes to reach a temperature of \(150^{\circ} \mathrm{C}\). So, near the end of the lecture the data-acquisition is stopped and the heating of the plate switched off. Studying the four graphs it is clear that the \(T^{4}\)-graph is the straightest line among the four (see Figure 385), so this is the best \(P-T\) relationship. ( \(T^{3}\)-graph “curves” upwards and \(T^{5}\)-graph “curves” downwards.)
Explanation#
We can obtain the Stefan-Boltzmann radiation law by integrating Planck’s radiation law over all \(\lambda\).
Remarks#
Do not start measurements directly after switching on the hot plate. Heat capacity of the system makes that at the very beginning, temperatures in the system are not equally distributed. That’s why we start measurements from \(30^{\circ} \mathrm{C}\) on. (In Figure 385 you can see this “switching-on”-effect in the graph at the left-side of the vertical Voltage-axis.)
This is also the reason why the plate should heat up slowly, otherwise measured temperature and measured radiation are not related properly.
The software also enables to apply a linear fit on the graphs recorded. This also shows that the \(T^{4}\)-graph has the closest approach to such a linear relationship (lowest chi’).
Sources#
Mansfield, M and O’Sullivan, C., Understanding physics, pag. 270-272
Young, H.D. and Freeman, R.A., University Physics, pag. 1256-1258