03 Kundt’s Tube#
Aim#
To show standing acoustic waves.
Subjects#
3B22 (Standing Waves)
Diagram#
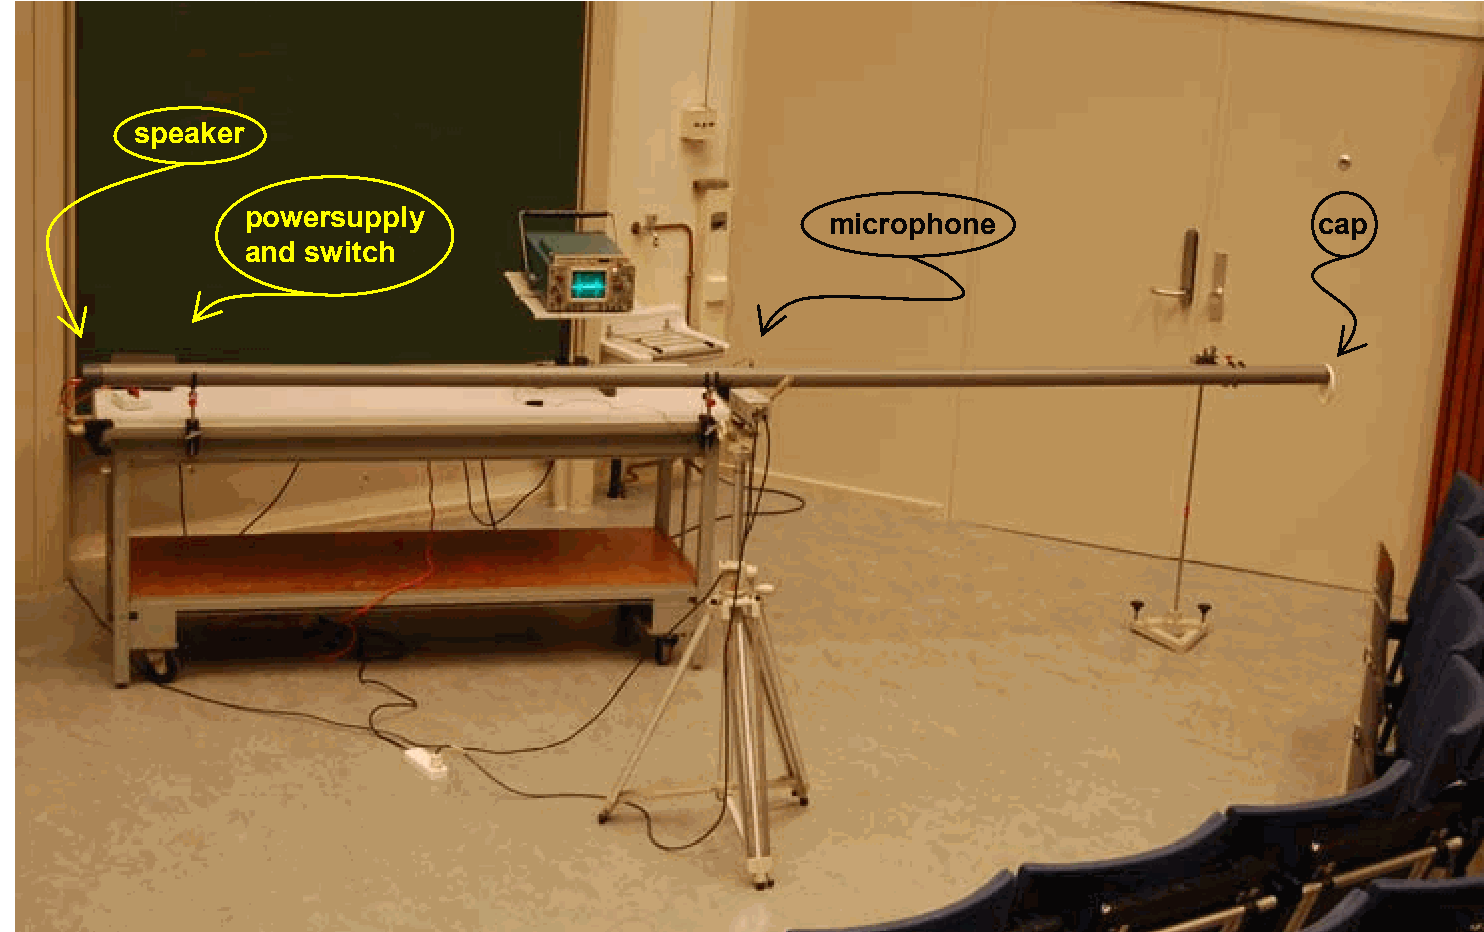
Fig. 351 .#
Equipment#
Longitudinal Wave Demonstrator.
Glass tube (with moveable piston).
Funnel, placed between glass tube and speaker.
Cork dust; poured into the glass tube and evenly distributed into a thin layer.
Loudspeaker.
Signal generator.
Meterstick.
Camera.
Safety#
The demonstrator should use ear plugs to protect his ears. Instruct the audience to place their hands to their ears.
Presentation#
Longitudinal Wave Demonstrator.#
Ask the students to concentrate on the white ends of the sticks of the wave demonstrator. These white ends represent “air molecules”. The distance between the white ends is a measure for “air pressure”.
Apply, by hand, a short pulse into this wave demonstrator and see how a compression displaces itself horizontally, reflects from the free end, and returns. This is similar to a pulse on a rope which they have seen before, so stress the difference: Now the “particles” have a velocity in the same direction as the pulse travels while on the rope the particle velocity is transverse to the movement of the pulse.
Also stress the observation that particle velocity differs from the velocity of the pulse. Make, by hand a standing wave in the wave demonstrator, with around 3, 4 nodes in it (see Figure 352A). Pay attention to “particles” that are not moving at all and “particles” that are moving fast, and observe that in places without “particle”-movement the distance between the “particles” changes strongly (= strong change in pressure), and in places with strong “particle”-movement the distance between the “particles” is almost constant (= no change in pressure).
[In this demonstration we stress these two observations, because in textbooks you often see drawings of standing waves in tubes showing either the displacement of air and/or the pressure in air. To students this can be confusing when they relate these pictures to what they see in a demonstration.]
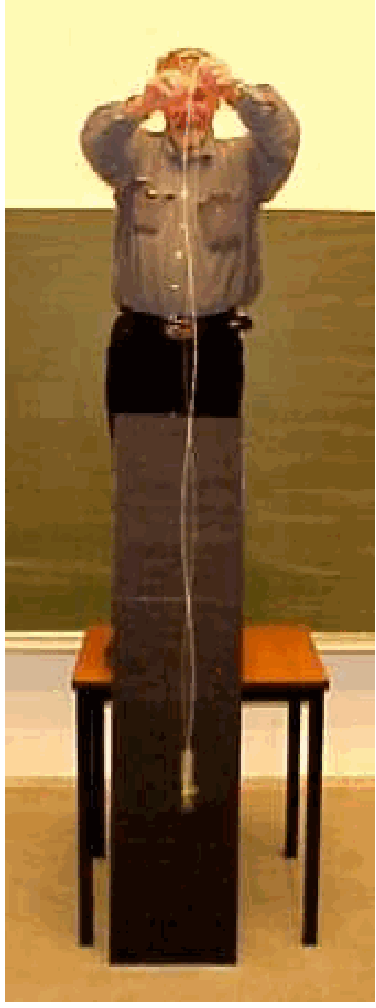
Fig. 352 .#
Open end tube.#
The camera focuses on the glass tube, the ruler and the frequency-reading of the signal generator (see the position of the camera in Diagram). The signal generator is set to a high amplitude and a loud sound is heard. The frequency is increased until a standing wave is observed in the cork dust (we start around 500 Hz and go up to a couple of kHz). At a standing wave we see that at certain places dust is swept away (anti-nodes in terms of displacement) and at other places dust collects (nodes) (see Figure 353). At the open end of the tube cork dust is swept out of the tube. Clearly air is moving fast at that open end (anti-node).
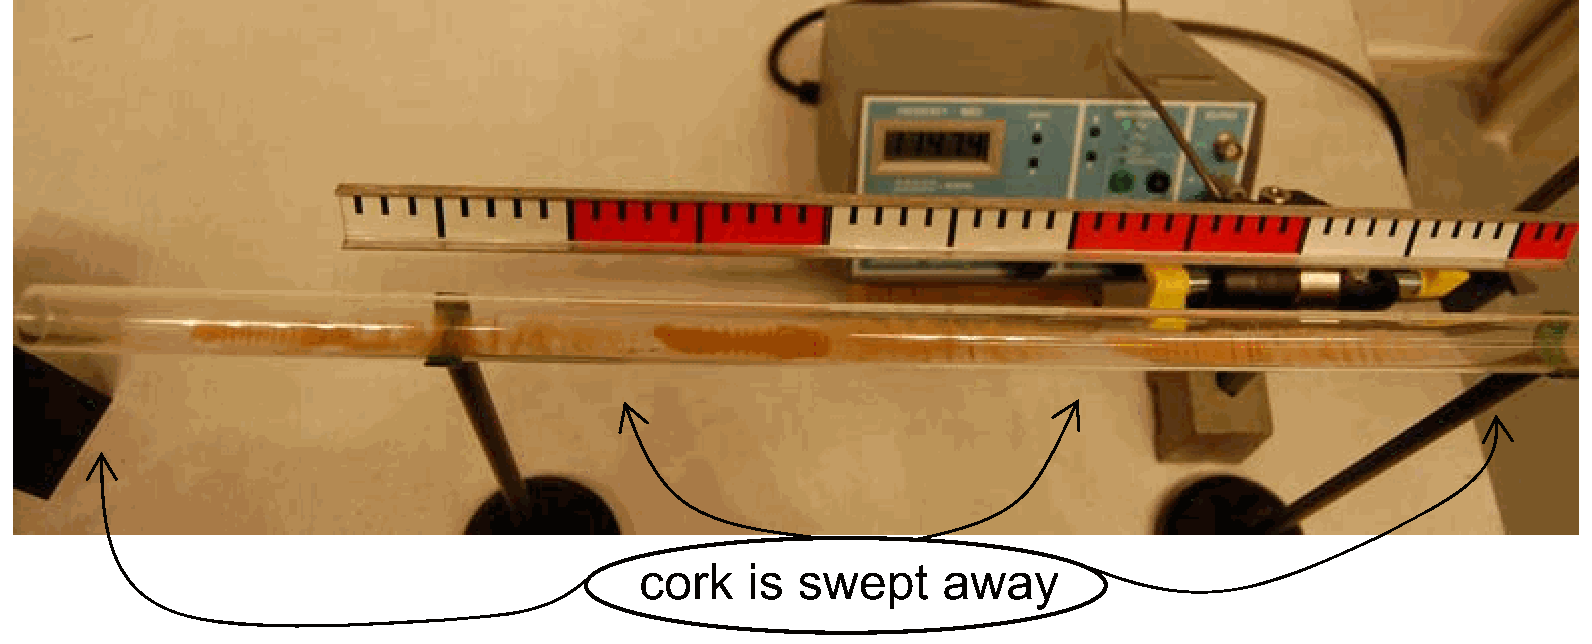
Fig. 353 .#
Closed end tube. The piston is shifted into the tube. The frequency of the signal generator is fixed at \(1\mathrm{~kHz}\) (this value enables easy calculations). The piston is displaced until again a standing cork dust pattern appears (see Figure 352B). We measure \(17 \mathrm{~cm}\) distance between two anti-nodes (half \(\lambda\)). With \(c=\lambda f\) we get \(c=340 \mathrm{~m/s}\).
Explanation#
In Kundt’s tube (1866) the cork dust is so light that moving air easily displaces it when a strong standing wave occurs. The cork is swept away at places where the air is in motion. The cork dust collects at places where the air is not moving. Referring to the Longitudinal Wave Demonstrator highlights what happens in Kundt’s tube, e.q.:
At a closed end the displacement of air is zero, while the pressure variations are maximum.
At an open end there are no pressure variations while the displacement of air is maximum.
At an open end the displacement of air goes beyond the length of the tube, so for nodes and anti-nodes the tube is a little “longer”.
Remarks#
In the area where cork dust collects, small vertical “curtains” appear, separated by around 4-5mm (see Figure 354). Probably this is caused by higher harmonics? We are not sure and until now found nothing of this phenomenon in literature. When it is a higher harmonics it can be useful to try to perform the experiment with other particles, because then a different curtain-separation will occur? When you know more we like to hear from you.
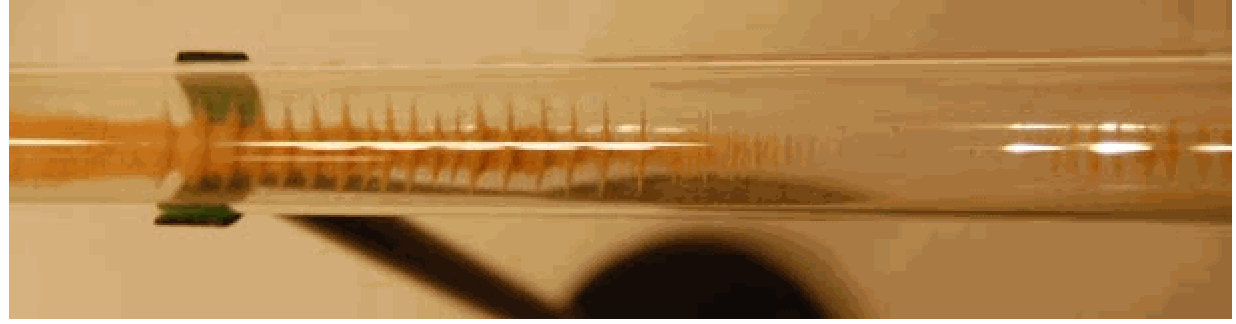
Fig. 354 .#
Sources#
Giancoli, D.G., Physics for scientists and engineers with modern physics, third edition, pag. 426-427.