4C10.01#
Compressing a Gas#
Aim#
Showing how to consider the work done on a gas
Subjects#
4C10 (PVT Surfaces)
Diagram#
Fig. 399 .#
Equipment#
Cylinder with piston. Piston diameter \(\varnothing=32.5 \mathrm{~mm}\)
Pressure sensor.
Position sensor.
Mass, \(5 \mathrm{~kg}\).
Blocks of wood.
Ruler.
Data-acquisition system.
Presentation#
Preparation: Set up the equipment as shown in Diagram. The mass of 5 kg is large compared to the cylinder with piston. We take care that the set up is also stable when that mass is positioned on the platform of the piston shaft. (See the thread that holds and guides the mass when moving, and the slanting shaft that fixes the vertical shaft that holds the cylinder. Also the blocks of wood under the cylinder give extra support.). The pressure sensor is connected to the cylinder. A thin wire, connected to the top of the mass and wound around the pulley of the Rotary Motion Sensor, makes it possible to measure the volume of the cylinder. In the software of Science Workshop a graph is prepared, showing pressure as function of cylinder volume. Pressure can be displayed directly in the graph; displaying volume on the x-axis needs some calculation, using the piston area. (see Figure 400 1).
Presentation#
Preparation:#
Set up the equipment as shown in Diagram. The mass of \(5 \mathrm{~kg}\) is large compared to the cylinder with piston. We take care that the set up is also stable when that mass is positioned on the platform of the piston shaft. (See the thread that holds and guides the mass when moving, and the slanting shaft that fixes the vertical shaft that holds the cylinder. Also the blocks of wood under the cylinder give extra support.).
The pressure sensor is connected to the cylinder. A thin wire, connected to the top of the mass and wound around the pulley of the Rotary Motion Sensor, makes it possible to measure the volume of the cylinder.
In the software of Science Workshop a graph is prepared, showing pressure as function of cylinder volume. Pressure can be displayed directly in the graph; displaying volume on the \(x\)-axis needs some calculation, using the piston area. (see Figure 400).
Presentation:#
The piston is placed in its highest position. The pressure inside the cylinder is atmospheric (around \(100 \mathrm{kPa}\) ) and the volume of the air chamber is \(100 \mathrm{ml}\). Be sure that the shut-off valve of the cylinder is closed.
The mass of \(5 \mathrm{~kg}\) is placed on the platform. A thumbscrew turned into the cylinder housing holds the piston still in this starting position.
Ask the students what they expect to see on the displayed graph.
Then data-acquisition is started, slowly the thumbscrew is released and the piston slides downward, compressing the gas. When equilibrium is reached the data acquisition is stopped. The gas volume is compressed to around \(70 \mathrm{ml}\). On the ruler we can see that the mass has fallen around \(3.5 \mathrm{~cm}\). A graph as displayed in Figure 400 is the result of this demonstration.
Fig. 400 .#
At first sight, the graph looks almost like a straight line. Usually students expect a more curved line because that is what is presented to them in textbooks. We perform a power fit on these results, showing that when in such a way our results are extrapolated, the function resembles the pictures we see in textbooks.
In the software we calculate the area under the measured PV curve, in order to know the work done on the gas in the cylinder. We find around 4J (see: Area in Figure 401). Then we calculate the work done by the mass: \(\Delta U=m g \Delta h=5 \times 10 \times 0.035=1.75]\) ! The difference is surprising; are we gaining in energy? Have we found a possible perpetuum mobile? Ask the students how they can explain this.
Explanation#
What the software is calculating is the work done on the gas inside the cylinder. From outside not only the mass of \(5 \mathrm{~kg}\) is standing on the piston, also the outside air with a pressure of \(100 \mathrm{kPa}\) is “standing” on it. This is an isobaric part of the area under the graph, representing an amount of work of around \(100 \mathrm{kPa} \times 30 \mathrm{ml}=3 \mathrm{~J}\) (see Figure 401). The remaining \(1 \mathrm{~J}\) is delivered by the mass of \(5 \mathrm{~kg}\). (The remaining \(0.75 \mathrm{~J}\), to get \(1.75 \mathrm{~J}\), is lost elsewhere.)
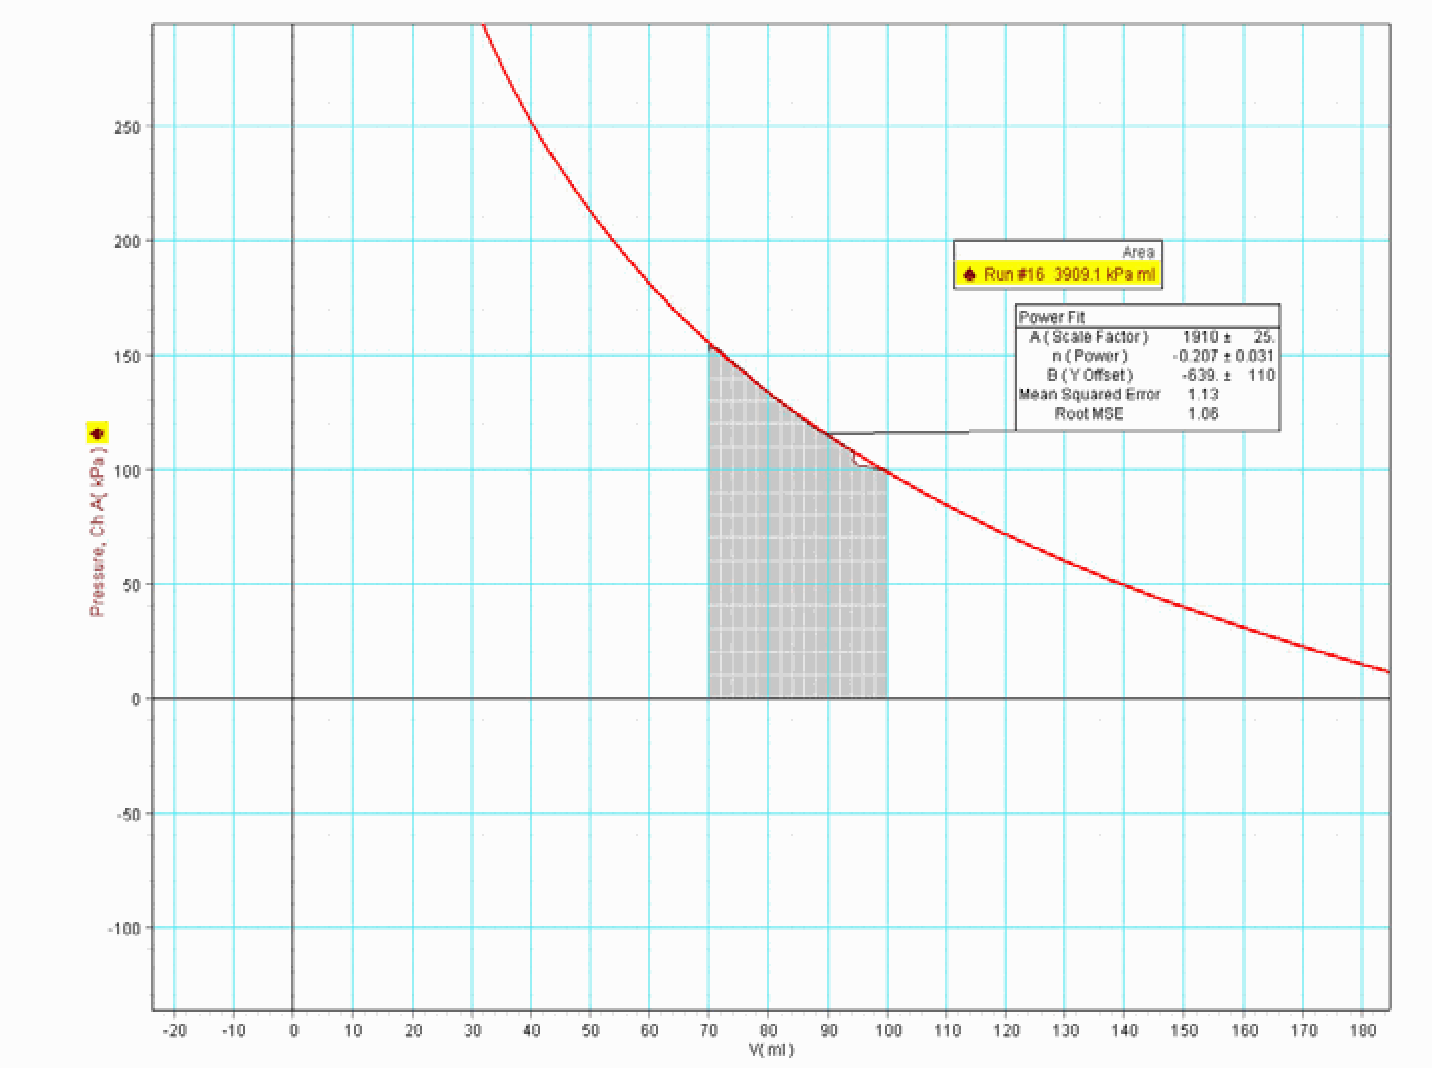
Fig. 401 .#
Remarks#
The process is more or less quasi-static because we release the thumbscrew, holding the piston, very slowly.