02 Kepler’s Third Law#
Aim#
To show empirically that Kepler’s third law is true.
Subjects#
1L20 (Orbits)
8A10 (Solar System Mechanics)
Diagram#

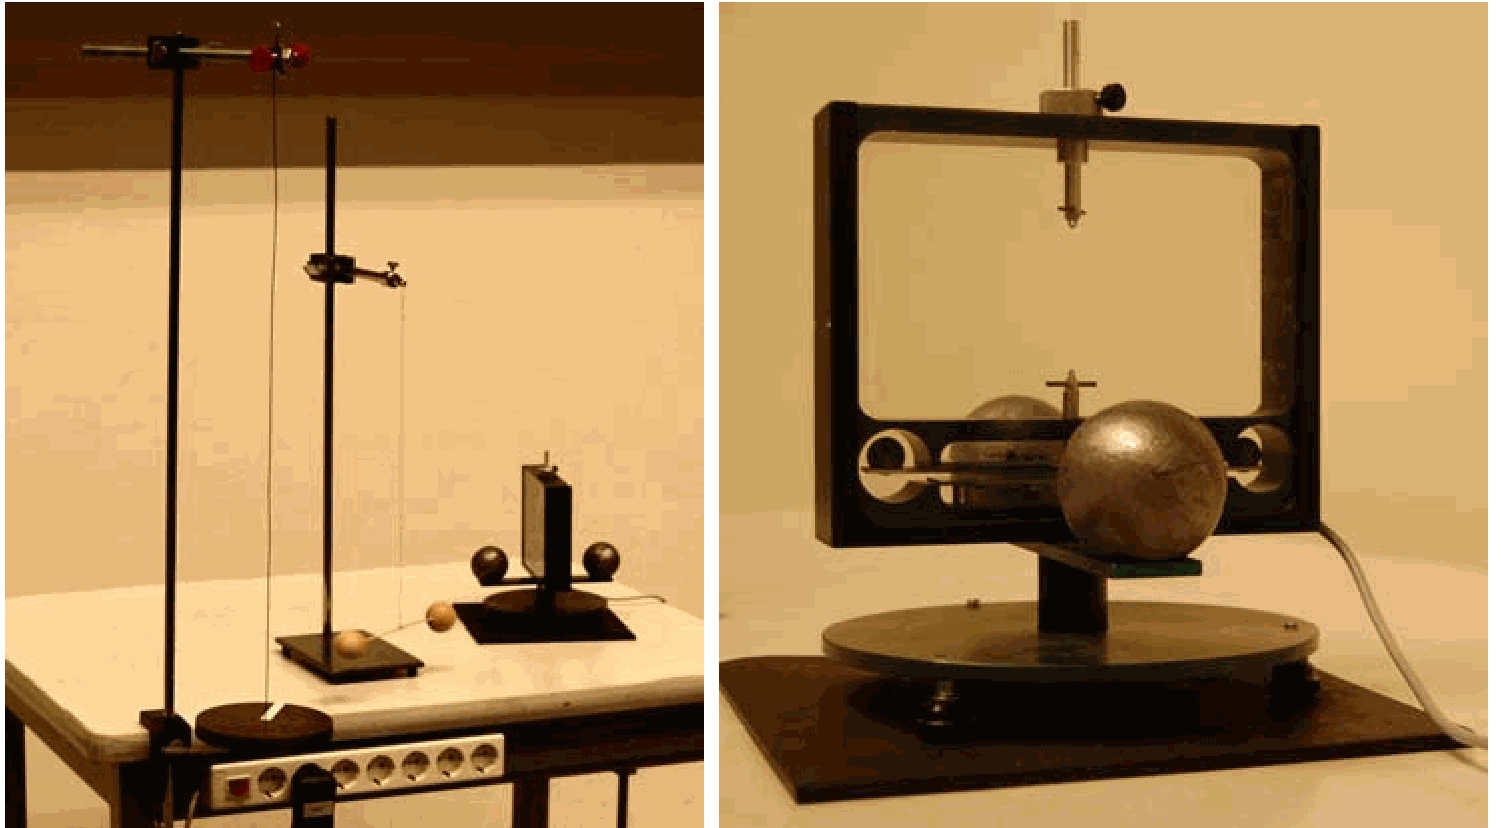
Fig. 141 .#
Equipment#
Graph on overhead sheet, \(T=f(a)\), \(T\) and a both scaled logarithmically.
Table with data of the planetary system (see Sources).
Presentation#
The graph is projected by means of an overhead sheet. The relationship with the table of planetary data is elucidated. Clearly can be observed that the data fit on a straight line in such a double logarithmic graph. The slope of this line (\(p/q\)) equals 1.5. This is the relationship of the powers in Kepler’s third law: \(T^2\propto a^3\)
Explanation#
Kepler’s third law states \(T^2=c \times a^3\) with \(c\) a constant. Taking logarithms on both sides, we can also write:
and:
So when T and a are graphed logarithmically (with \(x\)– and \(y\)-decades equally spaced), we see a line whose slope (\(\frac{3}{2}\)) is the power-relationship in the original function.
Simulations#
ISSUE: SIMULATION NEEDED
Sources#
Mansfield, M and O’Sullivan, C., Understanding physics, edition 1998, pag. 106-107 and 741 (planetary data).
BINAS tabellenboek, vijfde druk, tabel 31.
McComb, W.D., Dynamics and Relativity, edition 1999, pag. 72-74.
Roest, R., Inleiding Mechanica, vijfde druk, pag. 257-258.
Stewart, J, Calculus, edition 1999, pag. 867.
