01 Cooling by Insulation#
Aim#
To show a counterintuitve demonstration on thermal insulation. We compare the heating up of an insulated - and bare copper wire.
Subjects#
4B20 (Convection) 4B30 (Conduction) 4B40 (Radiation)
Diagram#
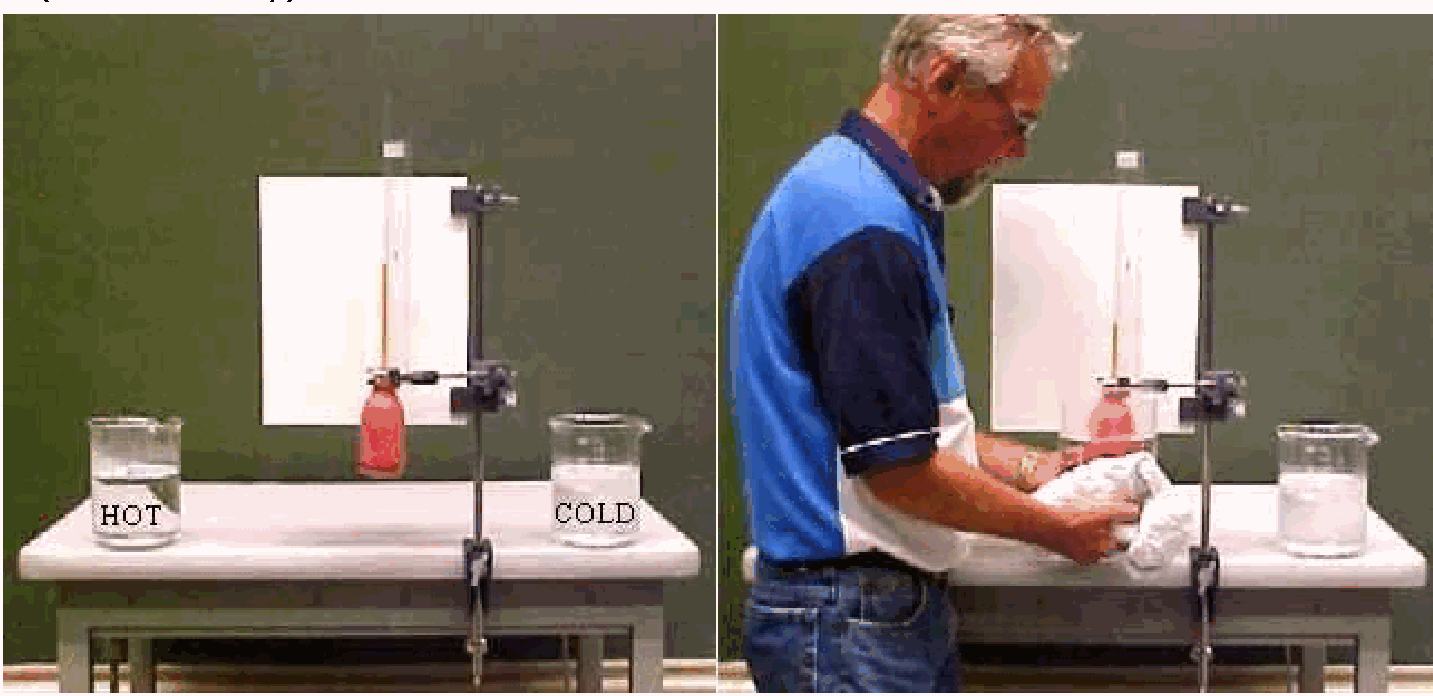
Fig. 378 .#
Equipment#
\(1.5 \mathrm{~m}\) of copper wire, \(d=0.7 \mathrm{~mm}\) (as used in house wiring) half of its length stripped of its insulation.
Two resistors of \(100 \Omega\).
Rheostat, \(11 \Omega\).
Adjustable current source, \(0\) to \(25\mathrm{~A}\).
Oscilloscope.
Lowpass LC-filter
Presentation#
The presentation is set up as shown in the diagram. The circuit is a Wheatstone bridge. Central part is the copper wire, half of its insulation removed. The oscilloscope is used as the balance detector in the bridge (the second not used scope-channel provides the zero reference line). \(5 \mathrm{~A}\) DC is made flowing through the bridge (flowing almost completely through the copper wire with its low resistance). In this situation the copper wire heats up only a little. Students can observe that the bridge can be balanced by means of the rheostat.
The current is increased to \(25\mathrm{~A}\). The oscilloscope shows that the Wheatstone bridge becomes unbalanced: the line on the screen displaces itself slowly from its zero reference line (stable after about half a minute). This unbalance must be due to the temperature-difference between the insulated - and bare copper wire. Students are asked which of the two wires will have the highest temperature. (Our experience is that almost all the students intuitively guess that the insulated wire has the highest temperature.) Now the bridge is balanced by means of the rheostat. The new balance of the bridge shows clearly that the bare copper wire has increased most its resistance value, so this wire has a higher temperature than the insulated wire!
Explanation#
See Figure 382A. \(T_{1}\) is the temperature of the hotter surface and \(T_{o}\) the temperature of the colder surroundings.
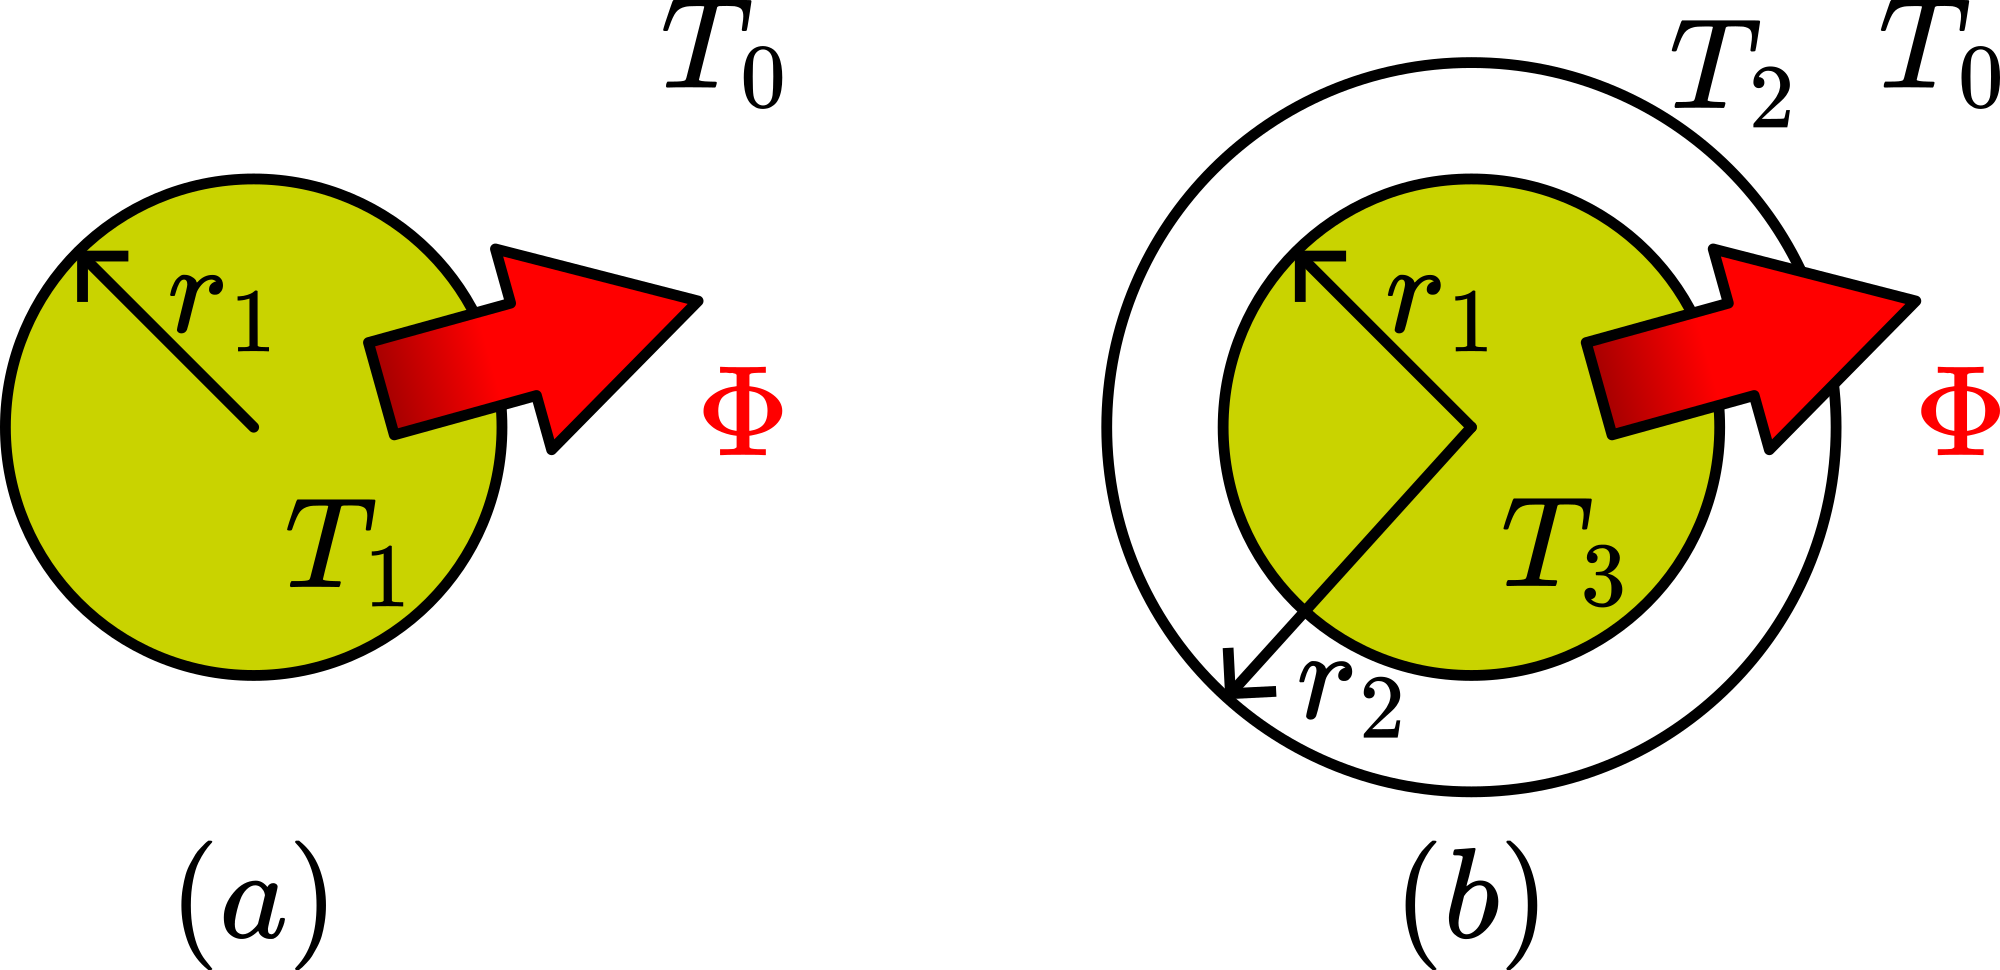
Fig. 379 .#
The rate of flow of heat \((\Phi)\) transferred through a surface \((A)\) from \(T_{1}\) to the surroundings with temperature \(T_{o}\) is given by \(\Phi=\alpha A\left(T_{1}-T_{0}\right)\) ( \(\alpha\) is the heat transfer coefficient accounting for convective and radiative heat transfer to the surroundings). This can also be written as \(T_{1}-T_{0}=\Phi \frac{1}{\alpha A} \cdot \Phi=\alpha A\left(T_{1}-T_{0}\right)\) is determined by the electric power dissipated in the wire. \(\frac{1}{\alpha A}=R_{t h}\) is the so called thermal resistance. The higher \(R_{t h}\), the higher the temperature of the wire ( \(T_{1}\) ) will be. In the situation of the bare copper wire \(R_{t h}=\frac{1}{\alpha 2 \pi r_{1} L}\) ( \(L\) being the length of the wire).
In the situation of the insulated copper wire (see Figure 382B) \(R_{t h}\) is made up of two thermal resistances in series: one resistance opposing the conduction through the insulation ( \(R_{t h 1}\) ) and the second opposing the transfer from the outer surface to the surrounding air ( \(R_{\text {th2 }}\) ). The problem of conduction through a cilindrical wall is treated in many textbooks:
\(R_{t h 1}=\frac{1}{2 \pi L \lambda} \ln \frac{r_{2}}{r_{1}}\). The total thermal resistance of the insulated copper wire is then \(\left(\frac{1}{2 \pi L \lambda} \ln \frac{r_{2}}{r_{1}}\right)+\left(\frac{1}{\alpha 2 \pi r_{2} L}\right)\).
In our demonstration the heat flow per second \((\Phi)\) is the same for the bare and the insulated wire. Therefore, the wire with the highest thermal resistance will have the highest temperature.
So we compare \(R_{t h}\) with \(R_{t h 1}+R_{t h 2}\);so we compare \(R_{t h}=\frac{1}{\alpha 2 \pi r_{1} L}\) with \(\left(\frac{1}{2 \pi L \lambda} \ln \frac{r_{2}}{r_{1}}\right)+\left(\frac{1}{\alpha 2 \pi r_{2} L}\right)\); so we can compare \(\frac{1}{\alpha r_{1}}\) with \(\left(\frac{1}{\lambda} \ln \frac{r_{2}}{r_{1}}\right)+\left(\frac{1}{\alpha r_{2}}\right)\). With the values of \(r_{1}=0.7 \mathrm{~mm} ; r_{2}=1.4 \mathrm{~mm} ; \alpha=6 \mathrm{~W} / \mathrm{m}^{2} K\) (surface in contact with air at rest); \(\lambda=0.2 \mathrm{~W} / \mathrm{mK}\) (thermal conductivity of \(\mathrm{pvc}\) ) it is easily calculated that the bare copper wire has a higher thermal resistance to its surroundings than the insulated wire. The increase in surface in insulating the wire has more effect on lowering the thermal resistance then the insulation itself has in increasing it.
Remarks#
Students should understand Wheatstone’s bridge before showing this demonstration.
Do not exceed the current above \(25\mathrm{~A}\) because of excessive heating of wires.
We use an oscilloscope as a balance-detector because then the increasing unbalance during heating up is clearly visible by a large group.
As rheostat we use a large slide resistance. With this slide resistance it is clearly visible in which direction the Wheatstone bridge is unbalanced when the copper wire heats up.
The circuit has a lot of noise induced into it, originating form the magnetic flux captured by the unavoidable large area of the wire loops in the circuit. This broadens the line on the screen of the oscilloscope. That’s why we use a low-pass LC filter at the input of the oscilloscope (see Figure 383).
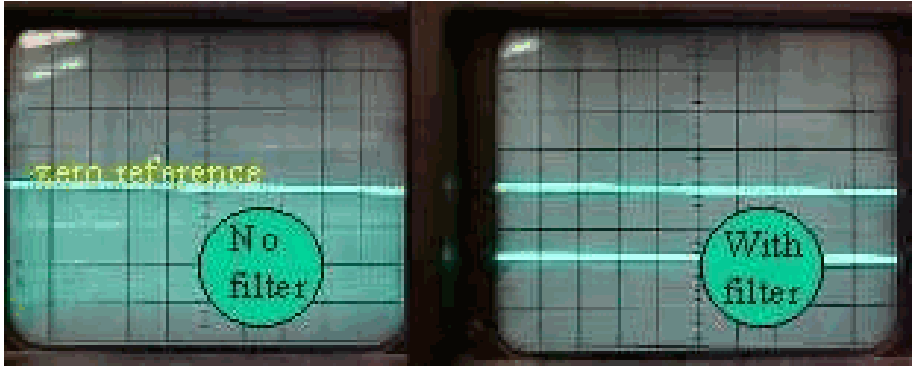
Fig. 380 .#
Because we use dc in this demonstration, thermal emf’s can be a nuisance. However we experienced that above currents of \(1\mathrm{~A}\) in the circuit their effects are negligible.
Sources#
Mansfield, M and O’Sullivan, C., Understanding physics, pag. 268-270