02 Mathematical pendulum (2) Large angle#
Aim#
To show that the period of motion of a simple pendulum depends on the angle the pendulum makes with the vertical.
Subjects#
3A10 (Pendula)
Diagram#
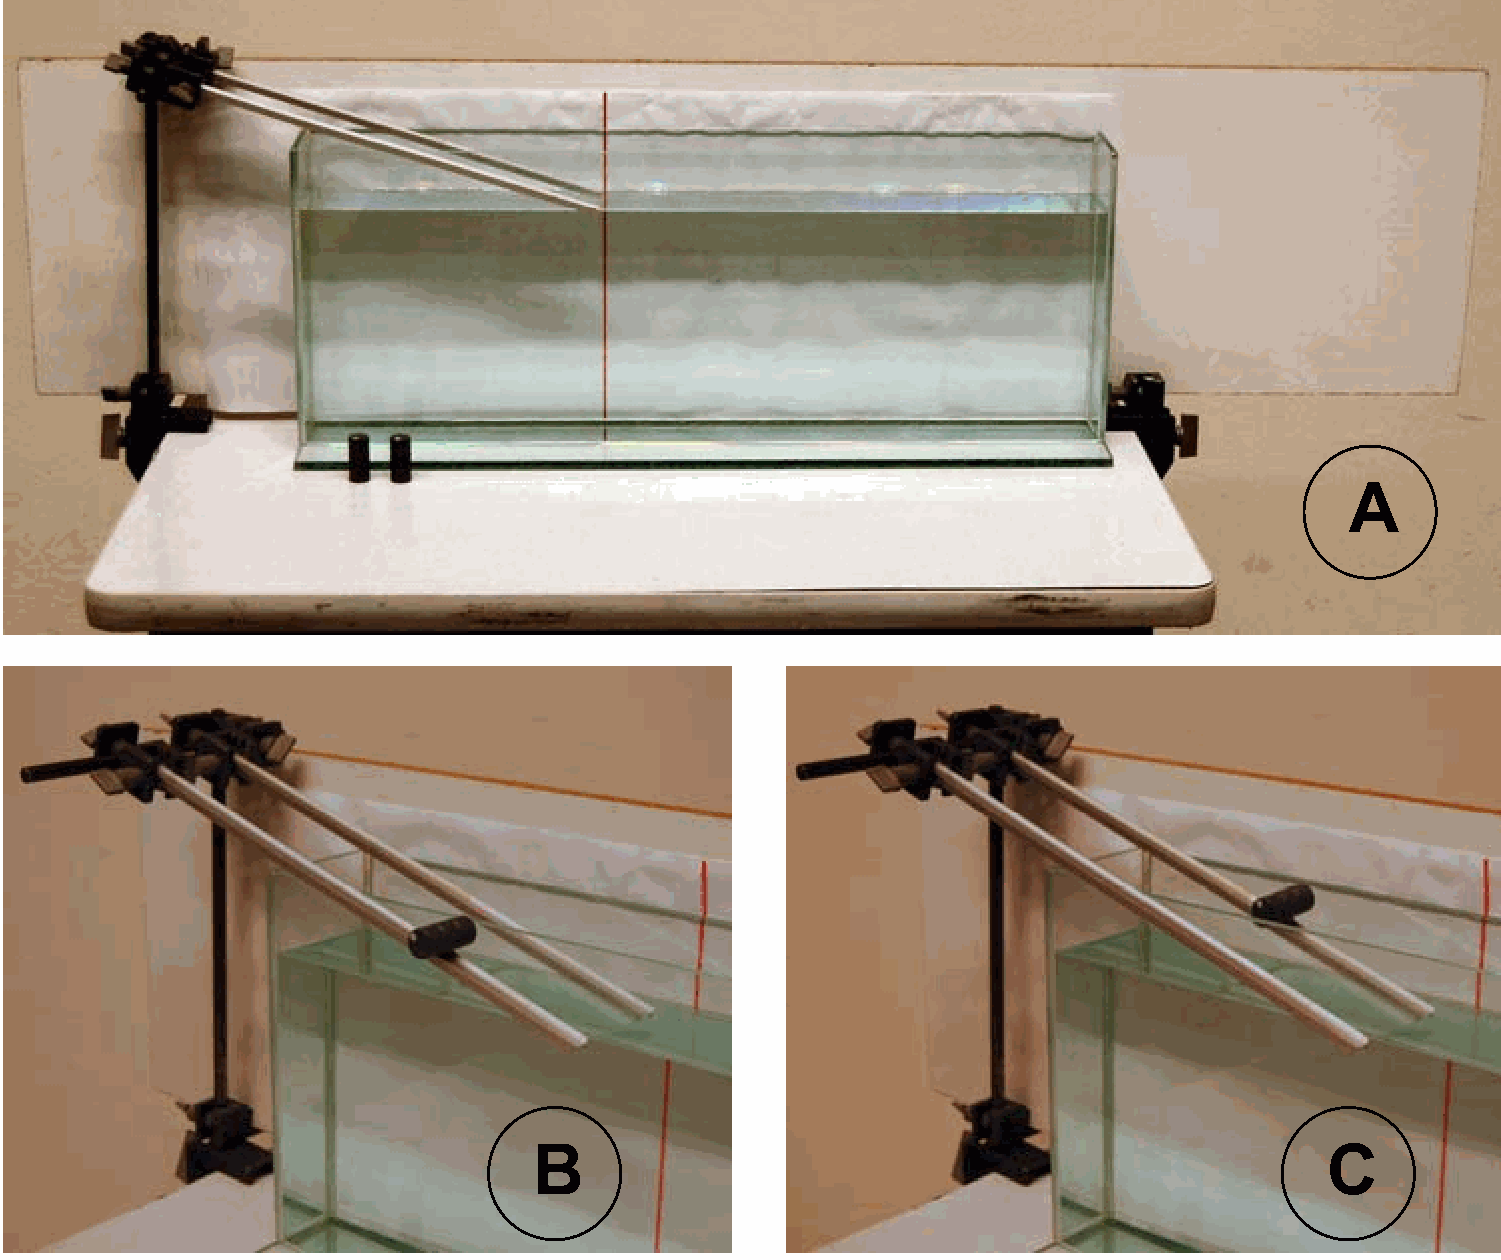
Fig. 292 .#
Equipment#
Pendulum; brass bob attached to a threaded rod \((I=50 \mathrm{~cm})\) and connected to a support with ball bearing.
Large cardboard with the principal angles of deflection indicated on it (see Diagram).
Photogate
Computerinterface.
Computer with data-acquisition system. (we use PASCO Science Workshop)
Presentation#
The photogate is placed just offset the rest-position of the pendulum. The data-acquisition system is set up in such a way that a graph of periodtimes can be presented. The data-acquisition is started, and by hand the pendulum is given a deflection of almost \(180^{\circ}\) and released. When \(\theta\) has reached angles smaller than \(90^{\circ}\), the data-acquisition is stopped. During the data-acquisition the students observe the graph displayed (see red line in Figure 293).
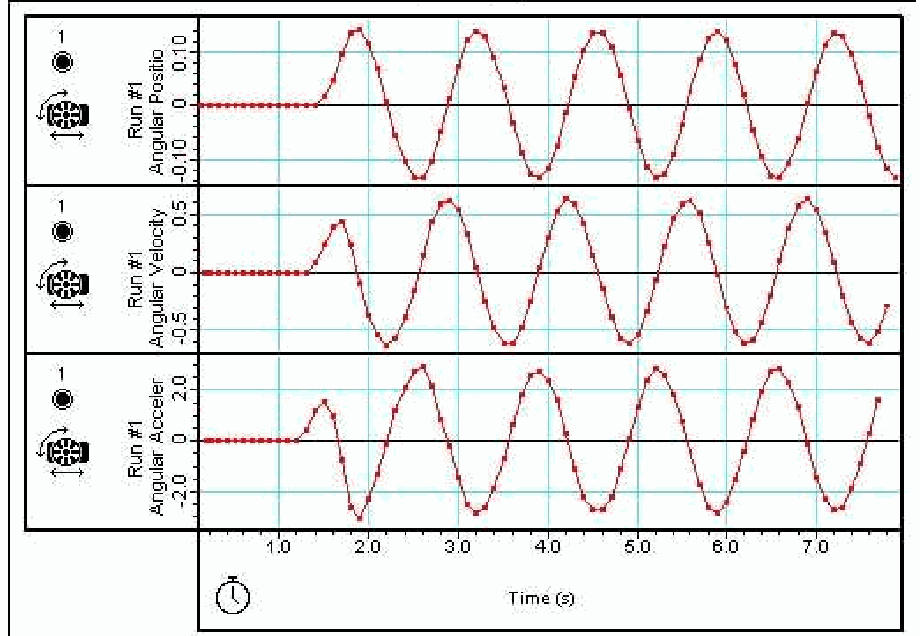
Fig. 293 .#
(This means that the expected range of the axes of the graph have to be prepared before the demonstration is started.)
A second run is made, giving the pendulum the smallest deflection possible. After about \(10-20\) registrations of \(T\) the data-acquisition is stopped. The complete graph can be observed and discussed now.
Explanation#
The equation that describes the motion of the mass \(m\) is given by \(a_{x}=\frac{d^{2 s}}{d t^{2}}=-g \sin \theta\) (x-direction along the tangent of the circle; see Figure 294A). This is not a simple harmonic motion since \(\sin \theta\) is not proportional to \(s\).
Only for small amplitude oscillations \(\sin \theta \approx \theta=\frac{S}{l}\) and the equation of motion reduces to \(\frac{d^{2} s}{d t^{2}}=-\frac{g}{l} s\) This is the differential equation for simple harmonic motion. Then the period is given by \(T=2 \pi \sqrt{\frac{l}{g}}\)
For large amplitudes we need \(a_{x}=-g \sin \theta\) in stead of \(a_{x}=-g \theta\). Since \(\sin \theta<\theta\), this means that \(a_{x}\) is smaller than the small-amplitude equation indicates: The mass will need more time than \(T=2 \pi \sqrt{\frac{l}{g}}\) to reach its maximum deflection. In other words: \(T\) is larger than \(2 \pi \sqrt{\frac{l}{g}}\).
(For an exact solution to the equation of motion: see SourcesXX.)
Remarks#
Also see the demonstration “Mathematical pendulum (1) - Simple harmonic motion”. With that demonstration the effect on the acceleration a can be observed very well.
When you observe the pendulum directly by eye it can be seen directly that the period of oscillation is larger at larger angles.
The software is setup in such a way that the period is presented after the pendulum has passed three times through the photogate. Every next period is presented after every second passage (see Figure 294B).
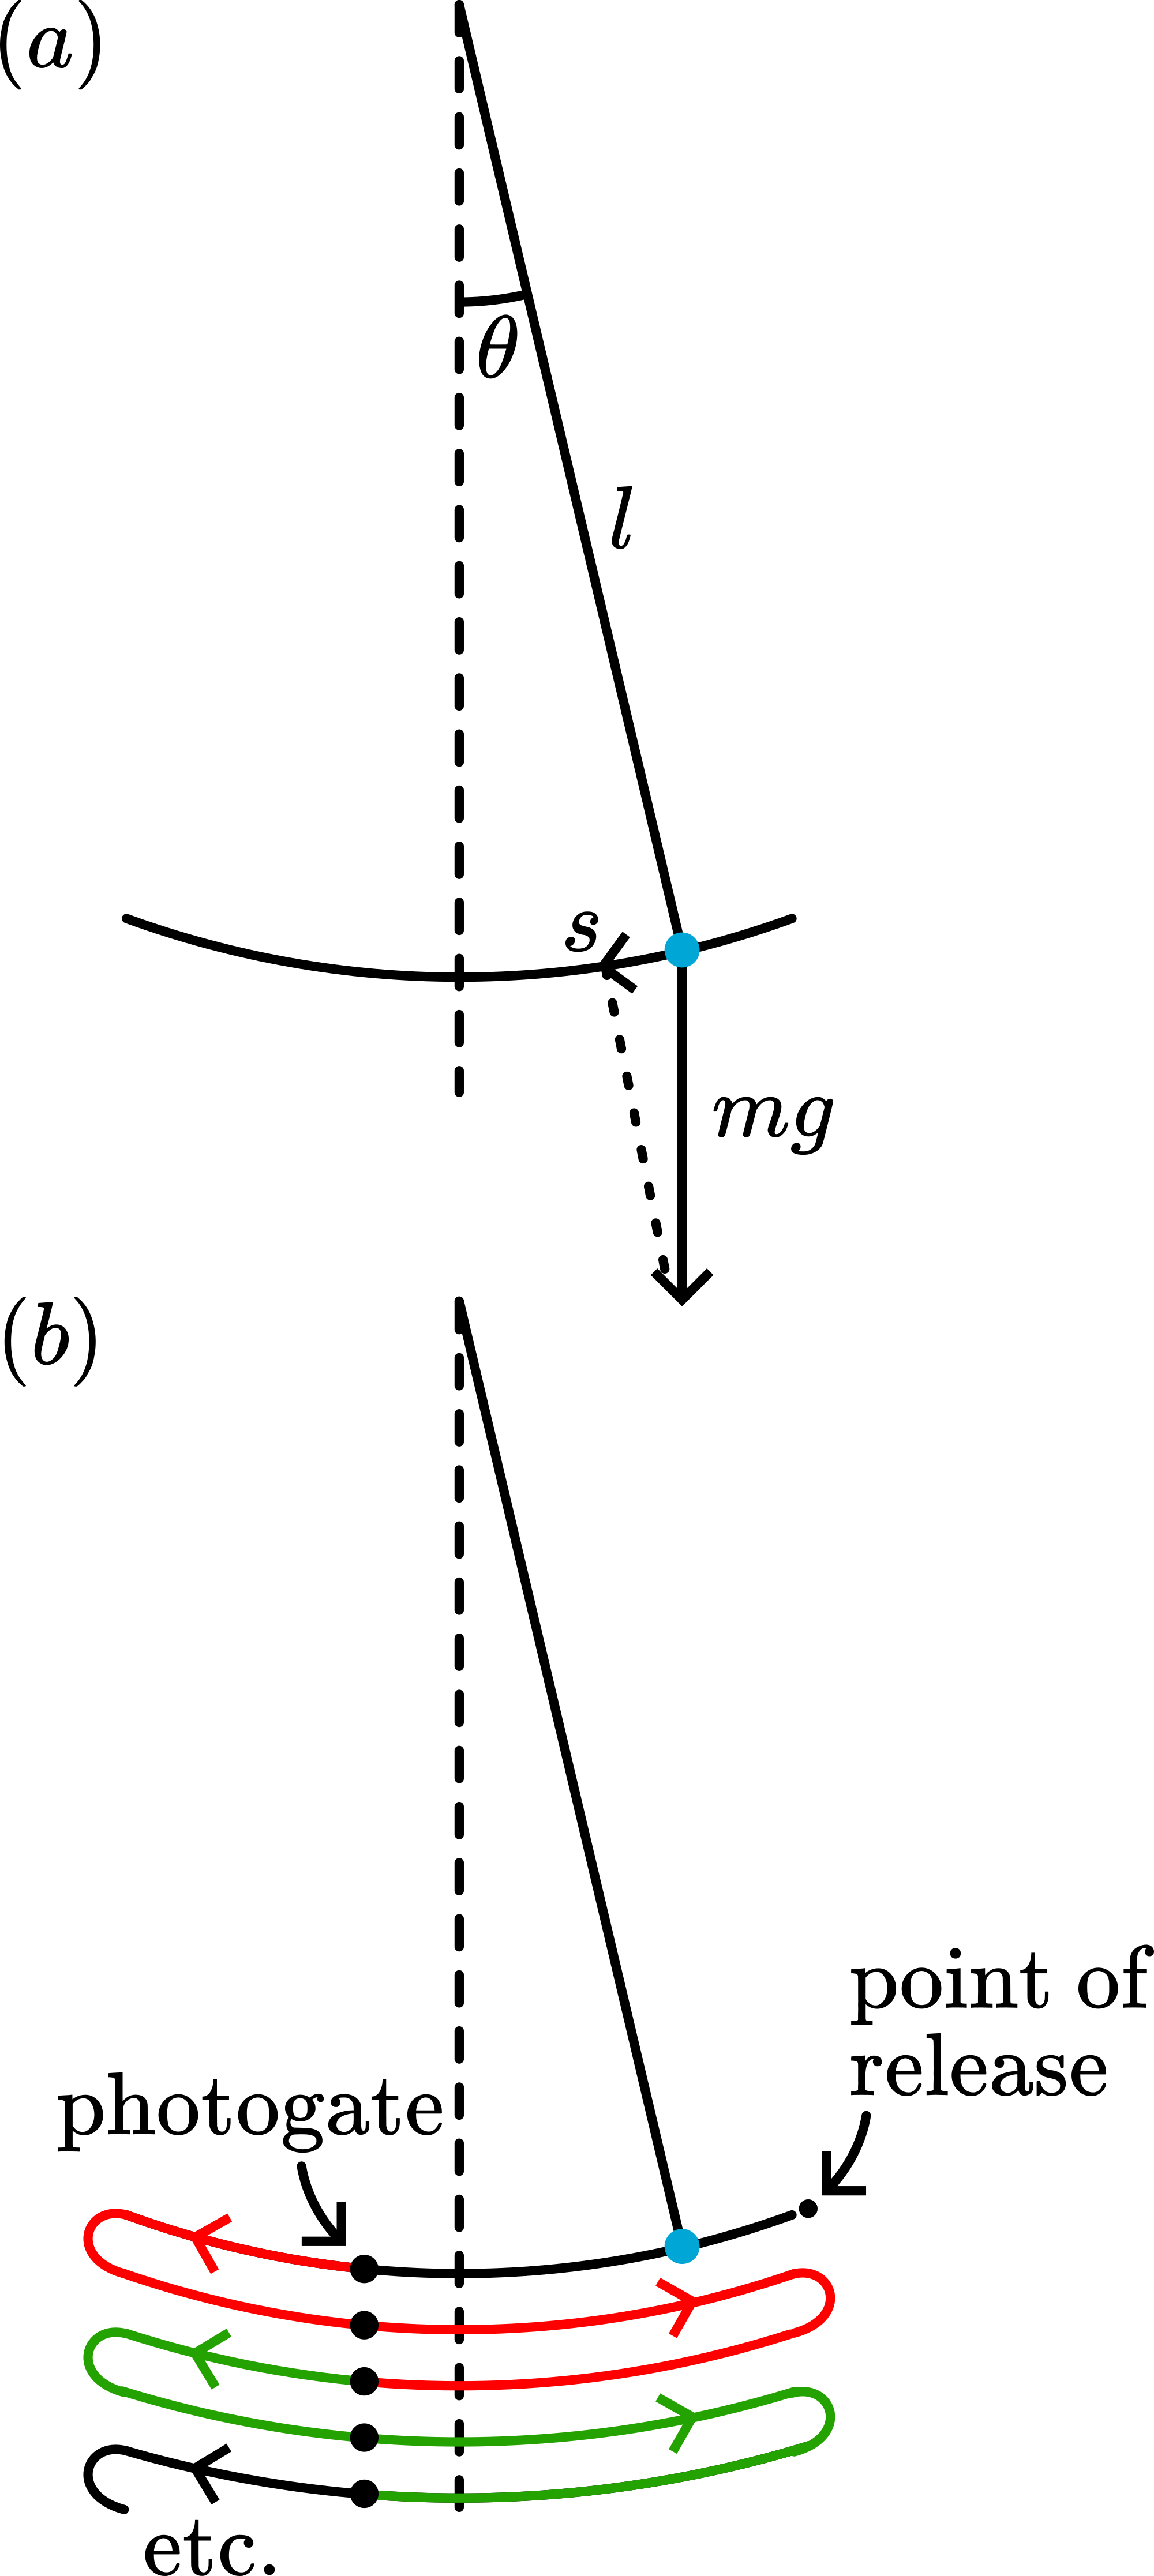
Fig. 294 .#
Since the system measures the complete period the position of the photogate can be at any arbitrary point along the arc of motion.
Sources#
Borghouts, A.N., Inleiding in de Mechanica, pag. 129-131
Mansfield, M and O’Sullivan, C., Understanding physics, pag. 72-73
Roest, R., Inleiding Mechanica, pag. 91-93